本文主要讲解画图工具matplotlib:- 创建图片
- 添加图片的颜色标记等
- 图片的刻度、标题、标签等添加
- subplot子图
图的创建
import matplotlib.pyplot as plt

import matplotlib as mpl

import numpy as np
中文显示问题
#显示

#显示gui,在行内显示

%matplotlib inline


#解决中文显示问题

mpl.rcParams['font.sans-serif'] = ['SimHei']

mpl.rcParams['axes.unicode_minus'] = False
画线性图
#画线性图(3,3)(1,8)(7,2)的坐标

plt.plot([3,1,7],[3,8,2])

#显示图片

plt.show()

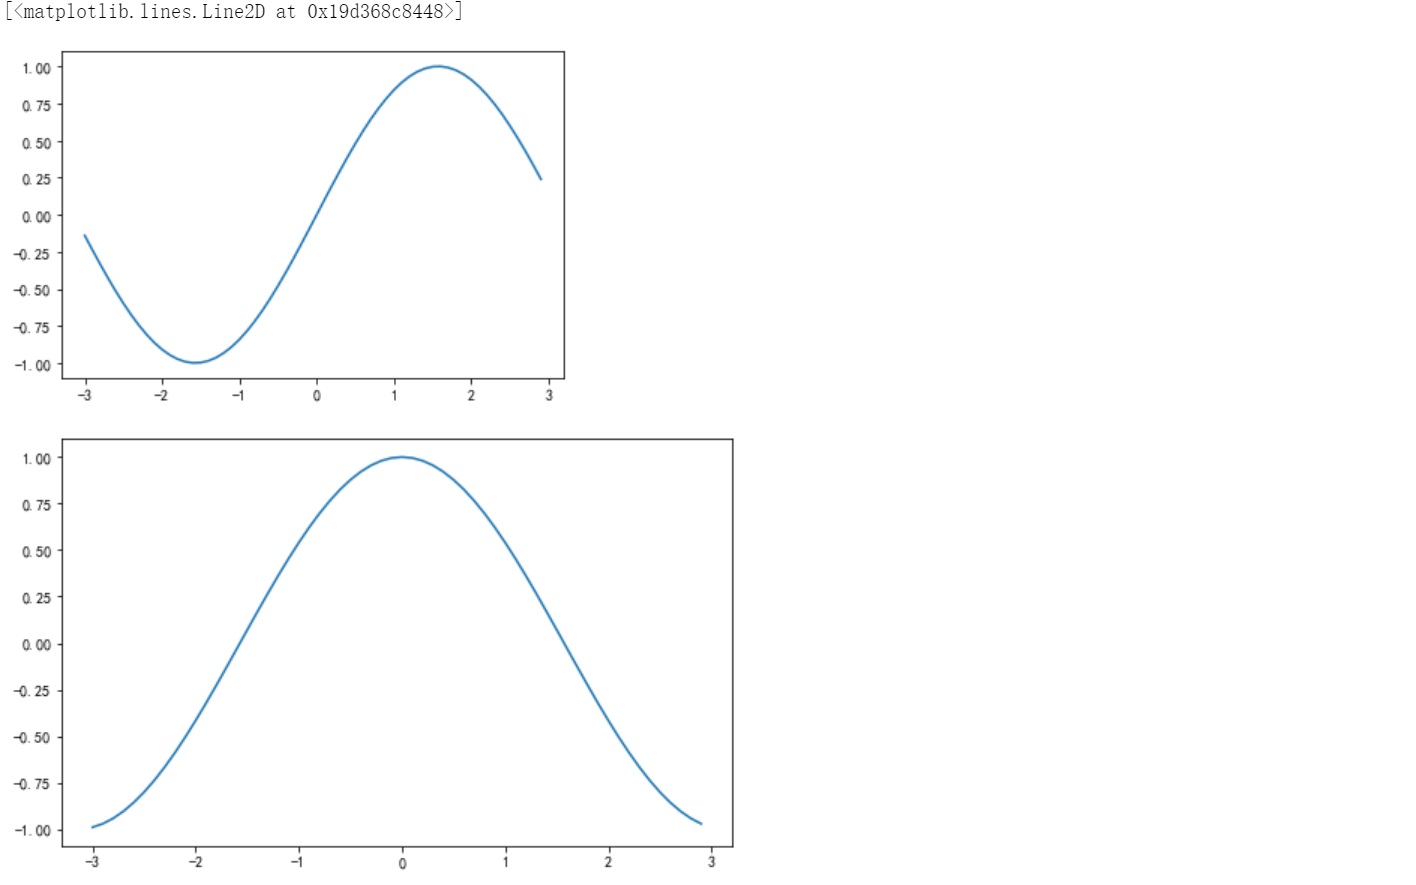
figure:图形,matplotlib中的所有图像都是位于figure对象中,一个图像只能有一个figure对象。matplotlib 的 figure 就是一个 单独的 figure 小窗口, 小窗口里面还可以有更多的小图片.
x = np.arange(-3,3,0.1)

y1 = np.sin(x)

y2 = np.cos(x)

#创建第一个图形

plt.figure()

plt.plot(x,y1)

plt.figure(num = 5,figsize = (8,5))

plt.plot(x,y2)

添加图片的颜色标记等
x = np.arange(-3,3,0.1)

y1 = np.sin(x)

y2 = np.cos(x)

#创建第一个图形

plt.figure()

#plt.plot(x,y1,x,y2)


#值传递一个值,默认为y值  ,而x 默认为 从0 - n

plt.plot([1,2,3,4,5])

plt.show()

x = np.arange(-3,3,0.1)

y1 = np.sin(x)

y2 = np.cos(x)


# plt.figure()

#plt.plot(x,y1,color = 'red')

#plt.plot(x,y1,color = 'red',linestyle = '-.')

#plt.plot(x,y1,color = 'red',linestyle = '-.',marker = '>')

#plt.plot(x,y1,color = 'red',linestyle = '-.',marker = 'o',markersize = 10,alpha = 0.5)


#简写方式

plt.plot(x,y1,'ro--')

plt.show()

查看手册
help(plt.plot)
图片的刻度、标题、标签等添加
x1 = [1,2,3]

y1 = [5,7,4]

x2 = [1,2,3]

y2 = [10,12,14]


plt.figure()

plt.plot(x1,y1,'ro-',label = '进口')

plt.plot(x2,y2,'bo--',label = '出口')


#设置标题标签

plt.xlabel('月份')

plt.ylabel('美元/亿')

plt.title('进出口数据')


#设置范围

plt.xlim(0,6)

plt.ylim(0,15)


#设置刻度

plt.xticks([1,2,3,4,5,6],[str(i)+'月' for i in range(1,7)])

plt.yticks(np.arange(2,16,2),['200','300','400','500','600','700','800'])


#获取坐标轴信息

ax = plt.gca()

#设置边框

ax.spines['top'].set_color('none')

ax.spines['right'].set_color('none')


#生成默认图例

plt.legend()


plt.show()

subplot子图
Subplot:子图,figure对象下创建一个或多个subplot对象(即axes)用于绘制图像。
x1 = [1,2,3]

y1 = [5,7,4]

x2 = [1,2,3]

y2 = [10,12,14]


#创建图像

plt.figure()

plt.subplot(221)#创建第一个子图

plt.plot(x1,y1,'ro--')


plt.subplot(223)#创建第二个子图

plt.plot(x2,y2,'bo-')


plt.show()

#面向对象的形式

#创建图形

fig = plt.figure()


#创建子图

ax1 = fig.add_subplot(221)

ax2 = fig.add_subplot(222)

ax3 = fig.add_subplot(212)


#在ax1上画图

ax1.plot(np.random.randn(50).cumsum(),'g--')

ax2.plot(np.random.randn(50).cumsum(),'b--')

ax3.plot(np.random.randn(50).cumsum(),'r--')


plt.show()

#例子:

fig,axes = plt.subplots(2,2 ,sharex = True,sharey = True)


for i in range(2):

  for j in range(2):

    axes[i][j].hist(np.random.randn(100),10,color = 'm',alpha = 0.75)

plt.subplots_adjust(wspace =0.3,hspace = 0.3)

fig.suptitle('test',fontsize = 20)


plt.savefig('aaa.png',dpi = 100)#保存图片

plt.show()

|